本文章使用工具从 Jupyter Notebook 转换而来。
本文将在课程结束后撤下。
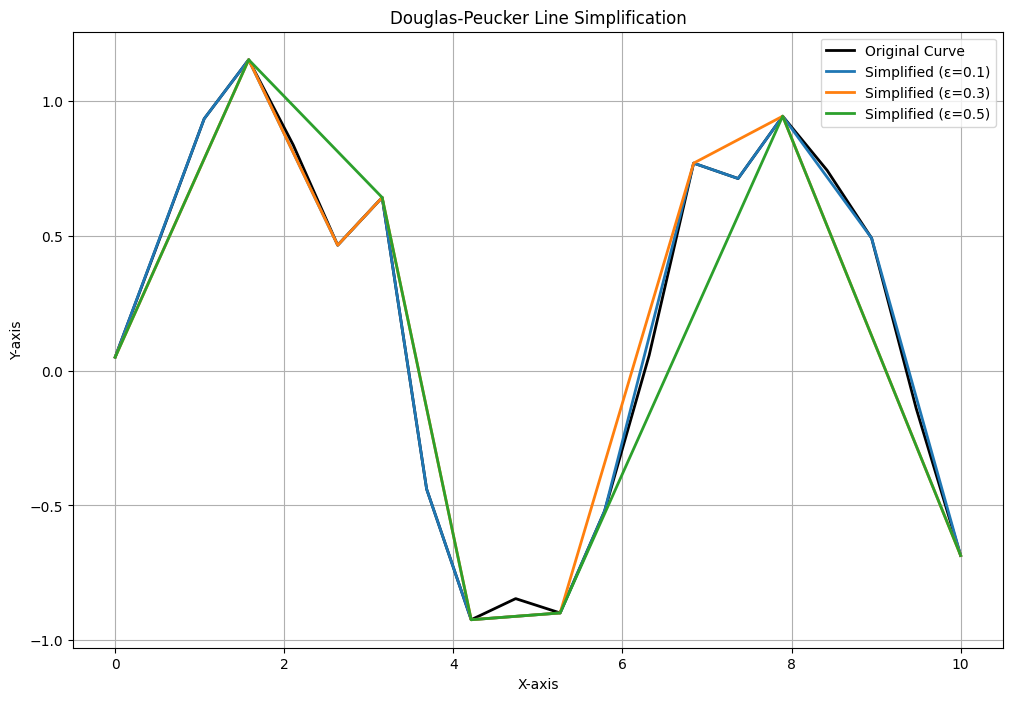
实验一:道格拉斯-普克实现曲线抽稀
算法的伪代码实现
function DouglasPeucker(PointList, epsilon):
    if length(PointList) <= 2:
        return PointList

    // 找到离首尾连线最远的点
    dmax = 0
    index = 0
    for i = 1 to length(PointList)-2:
        d = perpendicular_distance(PointList[i], Line(PointList[0], PointList[-1]))
        if d > dmax:
            index = i
            dmax = d

    // 递归处理
    if dmax > epsilon:
        result1 = DouglasPeucker(PointList[0:index+1], epsilon)
        result2 = DouglasPeucker(PointList[index:], epsilon)
        return result1[:-1] + result2
    else:
        return [PointList[0], PointList[-1]]
| |
| |
| |
| |
简答题:自动计算阈值的模型
基于曲线特征的自适应阈值模型
 1
 2
 3
 4
 5
 6
 7
 8
 9
10
11
def adaptive_threshold(points): # 计算曲线的总长度 total_length = 0 for i in range(len(points)-1): dx = points[i+1][0] - points[i][0] dy = points[i+1][1] - points[i][1] total_length += math.sqrt(dx*dx + dy*dy) # 基于曲线长度和点密度的自适应阈值 point_density = len(points) / total_length return total_length * 0.02 / point_density # 可调节系数基于曲率变化的阈值模型
- 计算各点的曲率变化率
- 在曲率变化大的区域使用较小阈值,平坦区域使用较大阈值
目标压缩率驱动模型
 1
 2
 3
 4
 5
 6
 7
 8
 9
10
11
def find_threshold_by_ratio(points, target_ratio): low, high = 0, max_distance(points) while high - low > 1e-6: mid = (low + high) / 2 simplified = douglas_peucker(points, mid) current_ratio = len(points) / len(simplified) if current_ratio > target_ratio: low = mid else: high = mid return (low + high) / 2统计分析模型
- 计算所有点到弦距离的统计特征(均值、方差等)
- 根据统计特征动态设定阈值:
threshold = mean + k * std
机器学习模型
- 使用历史数据训练回归模型
- 输入:曲线特征(长度、点数、曲率方差等)
- 输出:最优阈值